Like Quarto/Jupyter: document with
text (markdown and html)
math (LaTeX)
code
graphs
tables
Interactive with sliders, checkboxes etc.
Reactive: change one cell and the cells that depends on the cell changes (DAG-based)
Free (version) and wonderful infrastructure for hosting of notebooks on https://observablehq.com/
The Derivative
The Riemann integral
Second derivative measures curvature of a function
HTML | CSS | Javascript |
---|---|---|
![]() |
![]() |
![]() |
What to show (text) | How to show it (design) | What to do (interactivity) |
Javascript is the language of the web:
Runs in all major browsers without install
Just-in-time compiled. Pretty quick!
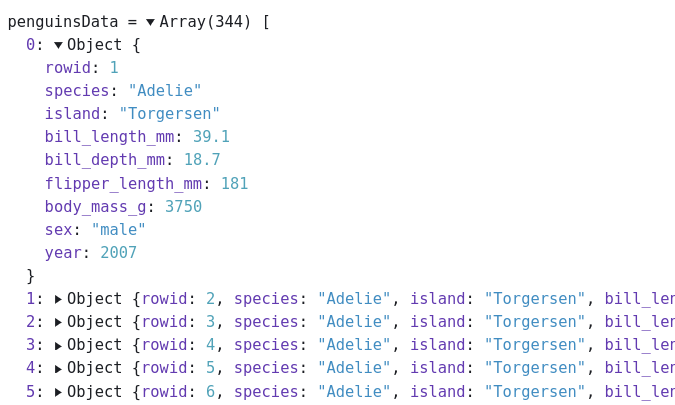
Full control, but much more low-level than Observable notebooks.
Builds on the Plot library by the creator of D3.
Javascript (almost)
Note: javascript uses zero-based indexing
The Plot library is based on the grammar of graphics (ggplot2 in R): 90% of time is setting up the right dataset.
Fundamental data structure is vector of objects (dictionaries).
Observable Framework: dashboards instead of notebooks
Examples: US electricity grid | interest rates
Example (embryo): Bayesian Learning dashboard
Different use case: better placement of multiple elements (graphs, sliders etc) on screen.
Data loaders from any language, e.g. R, Python, Julia.
Data loaders are executed at build time.
Any interactivity in real time still handled by javascript.
It is just code (not a notebook) = VS code + Git workflow.